An Advanced Python Trading Strategy: A Case Study on Algo Trading
Written on
Introduction to a New Trading Approach
In today's trading landscape, sticking with outdated algorithms like SMA crossover or RSI threshold breakout strategies is no longer viable. These methods have become ineffective due to their simplicity and the overwhelming number of traders attempting to apply them in the market. Instead, we should explore innovative strategies. In this article, we will harness Python alongside Benzinga's APIs to formulate and backtest a novel trading strategy aimed at outperforming the market.
With that in mind, let’s delve into the details!
Understanding the Trading Strategy
Before jumping into the coding aspect, it’s crucial to grasp the foundation of the strategy we will be implementing. Our approach is centered around a straightforward yet powerful breakout strategy.
- Entry Condition: We enter the market when the current high of the stock surpasses its 50-week high.
- Exit Condition: We exit the market when the current low of the stock drops below its 40-week low.
To monitor the 50-week high and the 40-week low, we will utilize the Donchian Channel indicator. This strategy operates on a weekly basis, so our backtesting will be conducted on a weekly timeframe.
Now that we have the strategy outlined, let's proceed to the coding section.
Importing Required Libraries
In this section, we will be using four primary libraries: pandas, requests, pandas_ta, and matplotlib. We will also use optional libraries such as termcolor and math. Below is the code to import these libraries into our Python environment:
# IMPORTING LIBRARIES
import pandas as pd
import requests
import pandas_ta as ta
import matplotlib.pyplot as plt
from termcolor import colored as cl
import math
plt.rcParams['figure.figsize'] = (20,10)
plt.style.use('fivethirtyeight')
Ensure that you have installed these packages using the pip command in your terminal if you haven't done so yet.
Gathering Historical Data
We will backtest our breakout strategy using Apple's stock data. To obtain historical stock information, we will leverage Benzinga’s Historical Bar Data API endpoint. The following Python function extracts Apple’s stock data starting from 1993:
# FETCHING HISTORICAL DATA
def get_historical_data(symbol, start_date, interval):
querystring = {"token":"YOUR API KEY","symbols":f"{symbol}","from":f"{start_date}","interval":f"{interval}"}
hist_json = requests.get(url, params=querystring).json()
df = pd.DataFrame(hist_json[0]['candles'])
return df
aapl = get_historical_data('AAPL', '1993-01-01', '1W')
aapl.tail()
In this code, we define a function get_historical_data that takes the stock symbol, start date, and interval as parameters. The function stores the API URL and query parameters, retrieves the data, and converts the JSON response into a Pandas DataFrame.
Now, let's proceed to calculating the Donchian Channel indicator based on the historical data obtained for Apple.
Calculating the Donchian Channel Indicator
The Donchian Channel indicator highlights the highest high and the lowest low of a stock over a defined timeframe. Here’s a brief overview of how to calculate it using pandas_ta:
# CALCULATING DONCHIAN CHANNEL
aapl[['dcl', 'dcm', 'dcu']] = aapl.ta.donchian(lower_length=40, upper_length=50)
aapl = aapl.dropna().drop('time', axis=1).rename(columns={'dateTime':'date'})
aapl = aapl.set_index('date')
aapl.index = pd.to_datetime(aapl.index)
aapl.tail()
In the first line, we use the Donchian function from pandas_ta to calculate the indicator, with parameters for the lower and upper lengths corresponding to our strategy's requirements. Afterward, we clean and format the DataFrame.
To visualize the Donchian Channel indicator, we will create a plot using Matplotlib:
# PLOTTING DONCHIAN CHANNEL
plt.plot(aapl[-300:].close, label='CLOSE')
plt.plot(aapl[-300:].dcl, color='black', linestyle='--', alpha=0.3)
plt.plot(aapl[-300:].dcm, color='orange', label='DCM')
plt.plot(aapl[-300:].dcu, color='black', linestyle='--', alpha=0.3, label='DCU,DCL')
plt.legend()
plt.title('AAPL DONCHIAN CHANNELS 50')
plt.xlabel('Date')
plt.ylabel('Close')
This code generates a visualization of the Donchian Channel for Apple stock. The chart effectively illustrates three key components of the indicator:
- Upper Band: Represents the highest high over the specified period.
- Lower Band: Indicates the lowest low for the same period.
- Middle Band: Calculates the average between the upper and lower bands.
The Donchian Channel is extensively utilized for identifying breakouts in stock price movements, which is why we incorporate it into our strategy.
Backtesting Our Trading Strategy
Now we arrive at the crucial step of backtesting our breakout strategy. The following code executes a basic backtesting process:
# BACKTESTING THE STRATEGY
def implement_strategy(aapl, investment):
in_position = False
equity = investment
for i in range(3, len(aapl)):
if aapl['high'][i] == aapl['dcu'][i] and not in_position:
no_of_shares = math.floor(equity / aapl.close[i])
equity -= (no_of_shares * aapl.close[i])
in_position = True
print(cl('BUY: ', color='green', attrs=['bold']), f'{no_of_shares} Shares bought at ${aapl.close[i]} on {str(aapl.index[i])[:10]}')
elif aapl['low'][i] == aapl['dcl'][i] and in_position:
equity += (no_of_shares * aapl.close[i])
in_position = False
print(cl('SELL: ', color='red', attrs=['bold']), f'{no_of_shares} Shares sold at ${aapl.close[i]} on {str(aapl.index[i])[:10]}')
if in_position:
equity += (no_of_shares * aapl.close[i])
print(cl(f'nClosing position at {aapl.close[i]} on {str(aapl.index[i])[:10]}', attrs=['bold']))
in_position = False
earning = round(equity - investment, 2)
roi = round(earning / investment * 100, 2)
print(cl(f'EARNING: ${earning} ; ROI: {roi}%', attrs=['bold']))
implement_strategy(aapl, 100000)
This code snippet implements the trading strategy based on predefined entry and exit conditions. It allows for straightforward trading decisions, and the results of the backtesting are as follows:
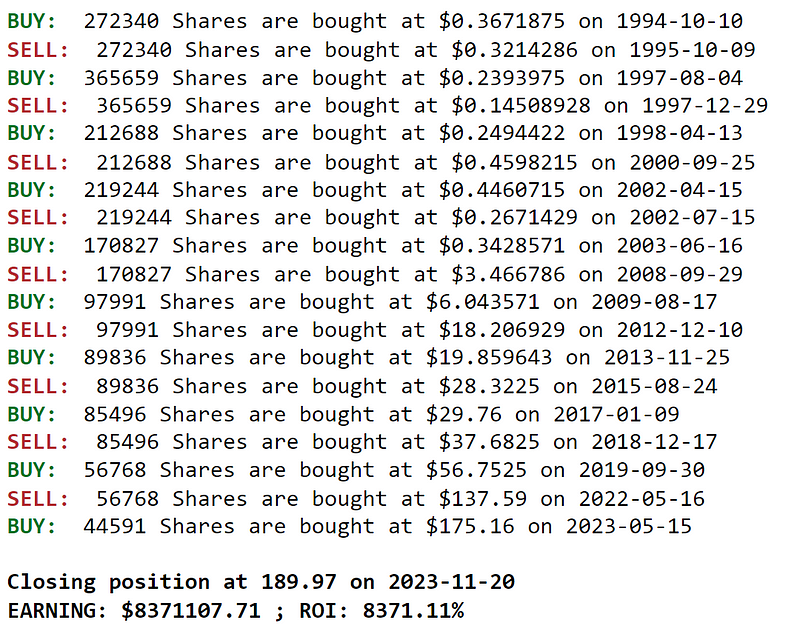
As indicated, our strategy has achieved an astonishing ROI of 8371%. However, we must verify whether this strategy genuinely surpasses the market performance.
Comparing with SPY ETF
To gauge our strategy's success, we can compare its backtesting results against the buy-and-hold returns of the SPY ETF. The following code calculates the returns of the SPY ETF over the years:
spy = get_historical_data('SPY', '1993-01-01', '1W')
spy_ret = round(((spy.close.iloc[-1] - spy.close.iloc[0]) / spy.close.iloc[0]) * 100)
print(cl('SPY ETF buy/hold return:', attrs=['bold']), f'{spy_ret}%')
In this code, we extract SPY's historical data and compute its return percentage, yielding the following result:
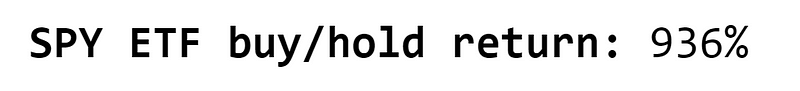
The SPY ETF’s buy-and-hold return stands at 936%, which is commendable; however, it pales in comparison to our strategy's impressive performance.
Conclusion
In this article, we thoroughly examined the process of coding to backtest a straightforward yet highly effective breakout strategy. As anticipated, the results were remarkable. We began by extracting Apple's historical data using Benzinga’s API, explored the Donchian Channel, and ultimately backtested our strategy while comparing it against the SPY ETF.
Numerous improvements could be made, including enhancing the backtesting system with considerations for brokerage fees and slippage, as well as implementing a robust risk management strategy. There are many avenues to explore, and I encourage you to investigate them further.
Before concluding, I want to extend my gratitude to Benzinga for providing an excellent suite of APIs that include top-tier market news and data. I hope you found this article informative and valuable. Thank you for your attention!
Explore an effective algorithmic trading strategy using Python, including coding and implementation insights.
Learn about algorithmic trading strategies in Python, focusing on practical applications and backtesting methodologies.