Mastering Time Series Forecasting with SQL: A Practical Guide
Written on
Introduction to Time Series Forecasting
In today's world, where big data and machine learning are at the forefront, the importance of predictive modeling in business cannot be overstated. Companies that harness predictive analytics are better positioned to maintain a competitive edge.
Why is Predictive Modeling Essential?
Predictive modeling offers numerous advantages:
- Enhanced Strategic Planning: Anticipating future events allows for more comprehensive strategy development, reducing potential errors.
- Optimal Resource Allocation: By identifying trends, organizations can divert resources from lower ROI projects to those with greater potential.
- Agility Over Competitors: Being able to forecast future occurrences enables quicker decision-making and adaptability.
While there are various predictive models, this article will delve into one particularly valuable method: time series forecasting.
Understanding Time Series Forecasting
Time series forecasting involves predicting future events based on historical data. Here are a few practical applications in business:
- Anticipating next month’s product demand to manage inventory levels.
- Estimating potential employee turnover for proactive hiring strategies.
- Projecting future stock prices to optimize investment portfolios.
These examples illustrate how businesses can leverage forecasting to prepare for upcoming events.
Types of Time Series Models
Among the many time series models available, we will focus on the simplest and most fundamental one: simple moving averages (SMAs).
How to Implement Simple Time Series Forecasting in SQL
We will now demonstrate how to perform basic time series forecasting using SMAs. An SMA calculates the average of a specific metric over a defined period, providing insight into long-term trends. While SMAs do not predict exact future values, they can offer valuable insights.
To calculate SMAs in SQL, you need two key components:
- A date column
- A column representing the metric you wish to forecast

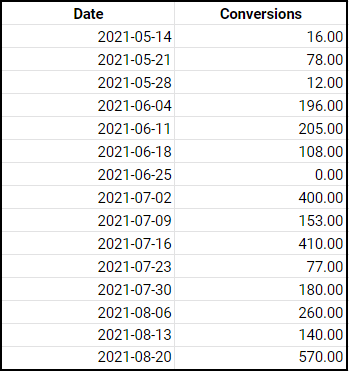
Example Dataset: Weekly Conversions
Consider a dataset showing weekly conversions from May 14, 2021, to August 20, 2021. To calculate a 7-day SMA for conversions, you can use the following SQL query:
SELECT
Date, Conversions,
AVG(Conversions) OVER (ORDER BY Date ROWS BETWEEN 6 PRECEDING AND CURRENT ROW) as SMA
FROM daily_sales
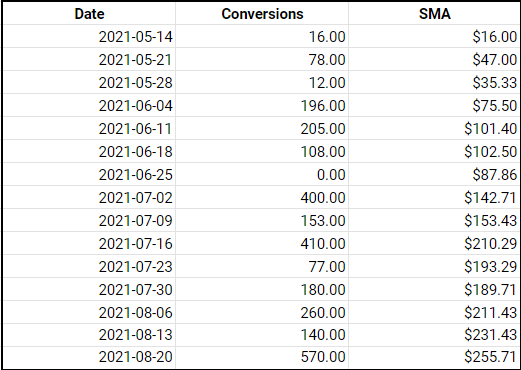
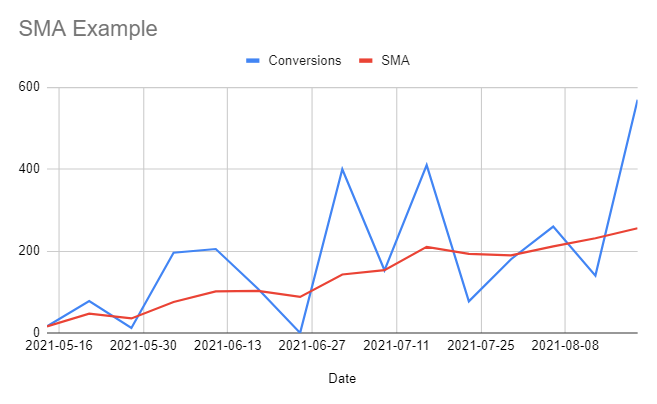
This query will produce a table and corresponding chart displaying the results:


Interpreting the Results
As illustrated, the chart depicts a volatile trend. While it may seem that conversions are increasing, this isn't always apparent.
From the 7-day SMA, we can derive the following insights:
- Overall Trend Analysis: The data indicates a rising trend in weekly conversions.
- Future Projections: If recent weekly conversions exceed the current SMA, an upward trajectory is likely. Conversely, if they consistently fall below the SMA, a downward trend may be anticipated.
And there you have it—an introduction to building and analyzing one of the most essential time series models in SQL!
Further Learning Opportunities
If you found this guide helpful, consider exploring additional resources:
Video Description: This video provides an in-depth analysis of time series data using SQL, demonstrating key concepts and techniques.
Video Description: A visual guide to understanding moving averages, this video breaks down the fundamentals of time series analysis.
For more insights and content on data science, be sure to subscribe for updates and further articles on valuable skills and resources in the field.