Creating an Effective Trend-Following Strategy with Hull MA
Written on
Understanding Trend-Following Approaches
Trend-following methodologies vary widely. This article presents an algorithmic method to validate trend changes, specifically through the Hull moving average.
I am excited to announce the release of my latest book following the success of “The Book of Trading Strategies.” This new volume delves into sophisticated trend-following indicators and methodologies, complemented by a GitHub repository for ongoing code updates. The book also features optimized color schemes for printing. If this piques your interest, feel free to check out the Amazon link below, or contact me via LinkedIn for a PDF version.
Trend Following Strategies in Python: How to Use Indicators to Follow the Trend.
Amazon.com: Trend Following Strategies in Python: How to Use Indicators to Follow the Trend.: 9798756939620: Kaabar…
www.amazon.com
The Hull Moving Average
Moving averages are essential for confirming and capitalizing on market trends. They are widely recognized due to their simplicity and effectiveness in enhancing analytical efforts. These indicators help identify support and resistance levels, set stops and targets, and understand prevailing trends. Their adaptability renders them crucial tools in any trader's toolkit.
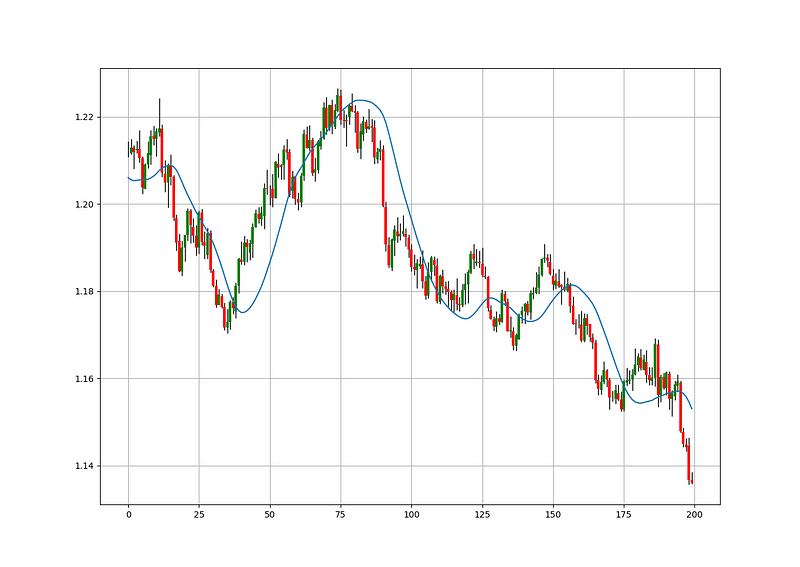
The Hull moving average builds upon the concept of the linear-weighted moving average, where the most recent data point carries the greatest weight, and the significance of earlier points diminishes progressively. This characteristic offers reduced lag compared to traditional moving averages, even though it is less frequently utilized.

To illustrate, consider a dataset of two values [1, 2]. The calculation for the linear weighted average would be as follows: (2 x 2) + (1 x 1) = 5 / 3 = 1.66. Here, the value 2 is the most recent observation. With this foundational understanding, let’s explore the Hull moving average, a robust tool for early trend-following systems.
The Hull moving average employs a weighted moving average as its foundation, calculated through these steps:
- Select a lookback period (e.g., 20 or 100) and compute the weighted moving average of the closing prices.
- Divide the first lookback period and calculate the weighted moving average with this new period. If the number is odd, round down (e.g., for a 15 lookback, use 7 or 8).
- Multiply the second weighted moving average by two and subtract the first weighted moving average from it.
- Finally, calculate the weighted moving average using the square root of the first lookback (e.g., for a 100 lookback, the third period would be 10) applied to the result obtained in step 3. Ensure this is not calculated on market prices.
Hence, if we choose a lookback of 100, we would calculate for periods of 100, 50, and finally 10.

Now, let’s delve into the Hull moving average strategy.
For those interested in exploring more articles, consider subscribing to my daily newsletter (a free plan is available) at the link below. It features my Medium articles, additional trading strategies, coding lessons, and subscribers receive a free PDF of my first book. You can expect 5–7 articles weekly with a paid subscription and 1–2 with the free plan, aiding my ongoing research dissemination. Thank you!
All About Trading!
Sharing Trading Strategies, Knowledge, and Technical Tools in Detail.
abouttrading.substack.com
Crafting the Strategy
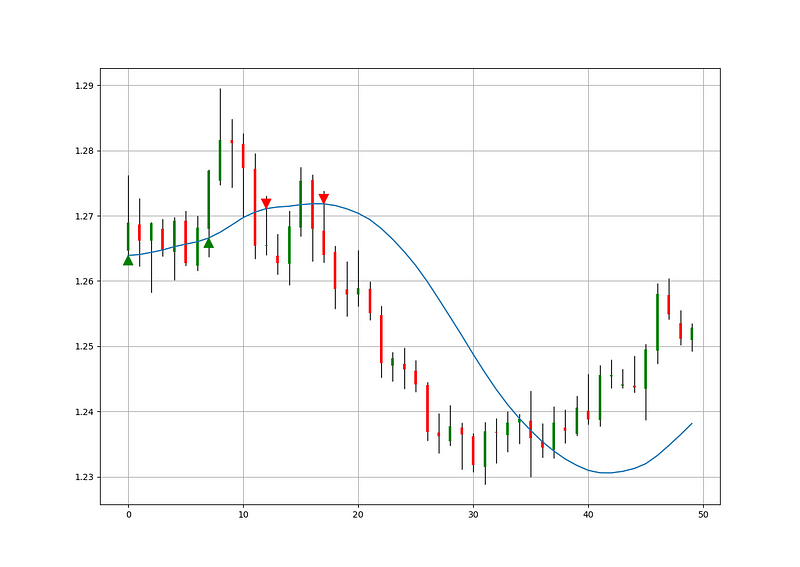
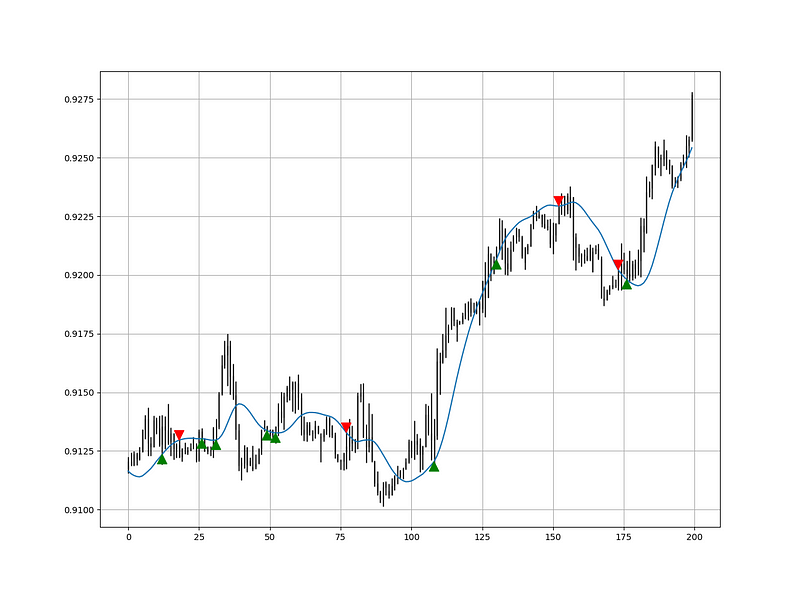
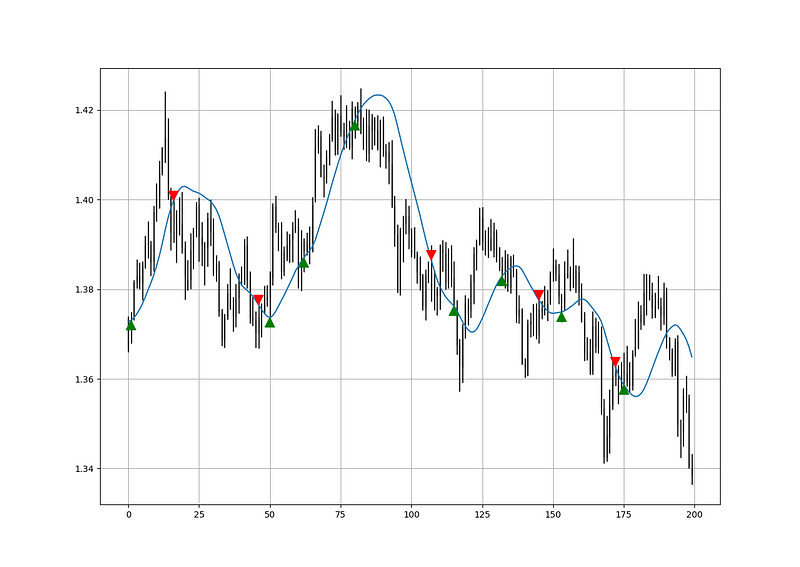
Unlike typical moving average crossover strategies, this approach dictates that we wait for a pullback after the market crosses the moving average to ride the emerging trend. Therefore, we will implement the following conditions in our coding:
- A long (Buy) signal is triggered when the market exceeds the 50-period Hull moving average and subsequently retraces towards the moving average through at least its low.
- A short (Sell) signal is activated when the market falls below the 50-period Hull moving average and then pulls back towards the moving average through at least its high.

Examine the USDCAD chart above. The initial bearish signal occurs after a significant red candle, followed by a pullback to the moving average, resulting in a bearish signal. The subsequent bearish signal showcases similar success. Notice the situation around point 37: the market surpasses the moving average but no bullish signal is generated. Why? The first bullish candle closing above the moving average is not followed by a retracement, invalidating it as a valid bullish signal.

def signal(Data, high_column, low_column, close_column, ma_column, buy_column, sell_column):
Data = adder(Data, 10)
for i in range(len(Data)):
# Bullish Signal
if Data[i, close_column] > Data[i, ma_column] and Data[i - 1, close_column] < Data[i - 1, ma_column]:
for a in range(i + 1, len(Data)):
if Data[a, low_column] <= Data[a, ma_column] and Data[a, close_column] > Data[a, ma_column] and
Data[a - 1, close_column] > Data[a - 1, ma_column]:
Data[a, buy_column] = 1
break
elif Data[a, sell_column] != 0:
breakelif Data[a - 1, sell_column] != 0:
breakelse:
continue
# Bearish Signal
elif Data[i, close_column] < Data[i, ma_column] and Data[i - 1, close_column] > Data[i - 1, ma_column]:
for a in range(i + 1, len(Data)):
if Data[a, high_column] >= Data[a, ma_column] and Data[a, close_column] < Data[a, ma_column] and
Data[a - 1, close_column] < Data[a - 1, ma_column]:
Data[a, sell_column] = -1
break
elif Data[a, buy_column] != 0:
breakelif Data[a - 1, buy_column] != 0:
breakelse:
continue
return Data

For those intrigued by additional technical indicators and strategies, my book may interest you:
The Book of Trading Strategies
Amazon.com: The Book of Trading Strategies: 9798532885707: Kaabar, Sofien: Books
www.amazon.com
Conclusion
Always ensure to conduct thorough back-testing. Keep in mind that while my indicators and trading style may work for me, they might not suit you. I advocate for self-learning rather than merely copying others. Grasp the core ideas, functions, and conditions of the strategy, then refine it to create an even better version that you can back-test and improve before going live or discarding it. My choice not to provide specific back-testing results encourages readers to explore and enhance the strategy independently.
Medium is a treasure trove of engaging reads. I absorbed countless articles before venturing into writing. Consider joining Medium using my referral link!
To summarize, are the strategies I present feasible? Yes, but only with an optimized environment (robust algorithms, low costs, trustworthy brokers, appropriate risk management, and order management). Are these strategies solely for trading? No, they aim to inspire brainstorming and generate more trading ideas, moving beyond clichés like an overbought RSI as a short trigger or a broken resistance as a long signal. I aim to introduce a new concept called Objective Technical Analysis, emphasizing data-driven techniques over outdated classical methods.
One Last Note
I recently launched an NFT collection aimed at supporting various humanitarian and medical initiatives. The Society of Light features limited collectibles, with a portion of each sale directed to the associated charity. Here are the benefits of purchasing these NFTs:
- High-potential returns: By focusing on marketing and promoting The Society of Light, I aim to enhance their secondary market value while ensuring a portion of royalties is donated to the same charity.
- Art collection and portfolio diversification: Owning avatars that represent positive actions is fulfilling. Investing doesn't have to be selfish; why not do it to earn, assist others, and appreciate art?
- Flexible donations to your preferred causes: This method allows you to allocate funds to your charities as you see fit.
- A complimentary PDF copy of my book: Each NFT buyer receives a free copy of my latest book linked in this article.

Discover a simple yet effective trading strategy that you can implement in just 60 minutes.
Unveil my straightforward and profitable trend-following trading strategy!