Choosing the Right Statistical Test: A Guide for Students
Written on
Understanding Statistical Tests
As a teaching assistant in statistics, I often encounter students from various backgrounds who struggle with certain concepts. One major challenge is not performing statistical tests themselves, but rather determining which test to apply. This article aims to provide a helpful flowchart that guides students in selecting the most suitable statistical test based on several criteria.

Overview of Statistical Tests
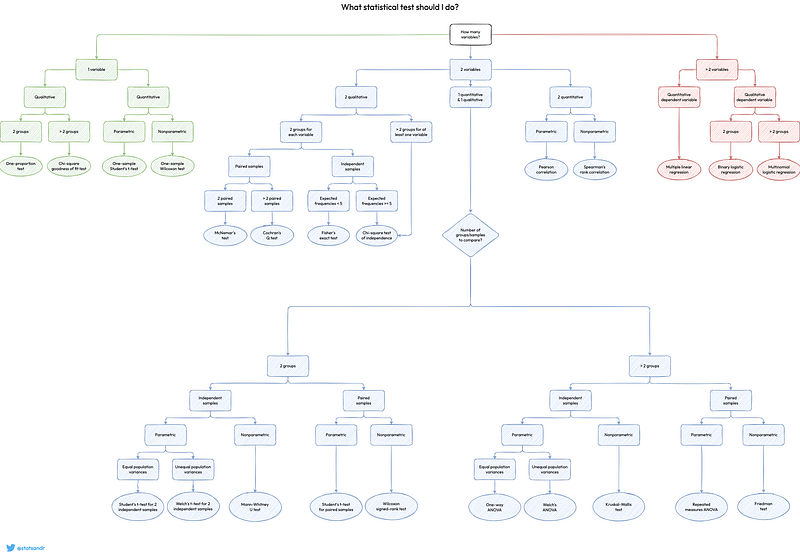
Given the extensive array of tests available, the accompanying image may appear broad and might not fit well on all devices. For a better view, you can download it in PDF format via the following link:
Download in PDF
The flowchart assists in choosing the right test based on the following aspects:
- The number of variables: one, two, or more.
- The type of variable: either quantitative or qualitative.
- If the variable is qualitative, the number of groups and their independence (independent or paired).
- The preference for parametric or nonparametric versions.
This flowchart simplifies the selection process for students by summarizing common tests in a concise manner. However, it is not exhaustive; many tests have been omitted to maintain clarity and avoid overwhelming users. The intention is to create a user-friendly tool that remains accurate and informative for most learners.
Additional Insights on the Flowchart
While tests for more than two variables can apply to cases with two variables, I often recommend the simplest option available for ease of understanding. For instance, when dealing with two quantitative variables, both a correlation test and simple linear regression are applicable. In introductory courses, I typically focus on correlation rather than regression unless students demonstrate a more advanced understanding.
Some tests, such as the Kolmogorov-Smirnov test—useful for comparing samples or distributions—are excluded since they are generally not included in entry-level classes. It's essential to note that tests for normality, like the Shapiro-Wilk test, are also omitted, although they play a crucial role in assessing the data distribution needed for many hypothesis tests.
The flowchart could be expanded to cover more complex models, but that is beyond its intended use. It serves to give non-experts a clear overview of frequently used statistical tests without causing confusion.
For those interested in exploring the flowchart further, you can click on the test names within the PDF to access detailed articles explaining each test. If a test is not clickable, it indicates that I have yet to write about it, but updates will occur as new articles become available.
I hope this guide aids you in identifying the correct statistical tests. Please feel free to share it with any interested students. If you have questions or suggestions about tests that should be included, I encourage you to leave a comment for the benefit of others.
For creating similar flowcharts, I utilized diagrams.net, which is currently free and allows synchronization with platforms like Google Drive and GitHub.
Parametric vs. Nonparametric Tests
A parametric test relies on a predefined statistical distribution characterized by specific parameters. In contrast, a nonparametric test does not depend on any particular distribution. Nonparametric tests aim to achieve the same outcomes as parametric ones but offer two advantages: they do not require a normality assumption and can accommodate outliers. However, they are generally less powerful than parametric tests when the normality assumption is satisfied. Thus, when conditions are met, it's advisable to use the parametric test for a higher likelihood of accurately rejecting a false null hypothesis.